
Pulse/Durable, Eino and Temporal: one comparison set
This page is the single current performance comparison for Pulse (with Durable for reliable execution), Eino and Temporal across execution, observation, resources, storage and recovery. The 2026-10-17 in-memory comparison remains unchanged; formal SQLite, Temporal native-persistence and process-recovery data are updated to the 2026-10-23 official-module rerun.
The two collections have different scopes. The new data is not presented as a full multidimensional rerun, and no unmeasured Go 1.26-versus-1.25 speedup is claimed.
Versions, samples and guarantees
The formal SQLite rerun targets the Pulse v0.5.1 release candidate. Core runtime source is unchanged from the v0.5.0 formal release; Go 1.26 is the unified toolchain. Durable and official sqlitestore use the formal v0.1.0 tag. No local replace.
| Component | Pinned identity |
|---|---|
| Pulse Core source baseline | v0.5.0 formal release / v0.5.1 release candidate |
| Durable / official sqlitestore | v0.1.0 / v0.1.0 |
| Eino | v0.9.21 |
| Temporal SDK / CLI / Server | v1.50.0 / 1.9.1 / 1.32.0 |
| SQLite driver | modernc.org/sqlite v1.60.1 |
| Formal SQLite benchmark host | Go 1.26.0 / windows/amd64 |
Windows 11 / i9-14900HX; GOMAXPROCS=4 per Go process, including Server, and business concurrency=4. This is not a four-core affinity limit shared across processes. chain/wide/diamonds, N=1/10/100/1000/10000, rounds=1/256. One node is one real task/regular Activity with actual direct-predecessor values. Per-node values, counts, concurrency and reuse are checked before freezing a non-race binary and rotating cases serially.
The table above is the historical 2026-10-17 full-dimensional matrix and remains only to explain the retained in-memory execution, observation and resource data. The current formal SQLite rerun has these valid records:
| Formal SQLite rerun matrix | Planned identities | Status |
|---|---|---|
| checkpoint / Pulse | 45 | 36 ok, 3 deadline, 6 not_repeated |
| checkpoint / Eino | 45 | 15 not_equivalent, 30 not_repeated |
| Temporal native | 45 | 30 ok, 1 deadline, 4 hard_timeout, 10 not_repeated |
| recovery | 36 | 36 ok |
The formal rerun has 171 valid records and retains another 45 Temporal checkpoint configuration diagnostics; its overall status is COMPLETED_WITH_ERRORS. — means no completed cost, never zero; timeouts and not_repeated points are neither zero-filled nor extrapolated. The historical 1062 planned identities are not combined with the formal SQLite numbers.
| Dimension | Pulse / Durable | Eino | Temporal |
|---|---|---|---|
| Native execution | In-memory Pulse, fresh Execution per run | compose Graph, AllPredecessor, unique output keys | Real Server/worker, always native persistence |
| Observation | Observer lifecycle counters | Graph/Lambda start/end/error callbacks | Non-replay Workflow/Activity interceptors |
| Reliable confirmation | Durable Store confirmation before publication | No automatic per-node save on normal success; active CheckPointStore interrupt separately | Native history and Activity completion confirmation |
| Recovery | Kill host after confirmed prefix; new-process Resume | Exit after active checkpoint; new-process resume | Confirmed prefix without in-flight Activity, worker kill; Server restart separately |
Eino's host semaphore limits business bodies. Its host cancels and joins those bodies after errors, without promising all engine goroutines have exited. Temporal sets MaximumAttempts=1 and acquires the workflow semaphore after dependencies, before scheduling Activities.
Native execution and preparation
The following rounds=1 numbers are ms, medians of five repeated reuse-batch means. Windows uses QPC to resolve short intervals. CSV retains min–max, both workloads, first runs and setup. These are not online p50s or confidence intervals.
| shape / N | Pulse (ms) | Eino (ms) | Temporal (ms) |
|---|---|---|---|
| chain / 1 | 0.0043375 | 0.0065289 | 253.826 |
| chain / 100 | 0.262107 | 0.613691 | 5049.45 |
| chain / 1000 | 2.81535 | 38.6123 | — |
| chain / 10000 | 31.2935 | 4867 | — |
| wide / 1 | 0.0043377 | 0.0062323 | 229.887 |
| wide / 100 | 0.170895 | 0.714113 | 1374.74 |
| wide / 1000 | 1.87012 | 39.9403 | 11183.6 |
| wide / 10000 | 19.2415 | 4824.91 | — |
| diamonds / 1 | 0.00406 | 0.0064852 | 225.973 |
| diamonds / 100 | 0.282539 | 0.834692 | 3400.07 |
| diamonds / 1000 | 2.87873 | 40.5372 | — |
| diamonds / 10000 | 34.214 | 4796.76 | — |
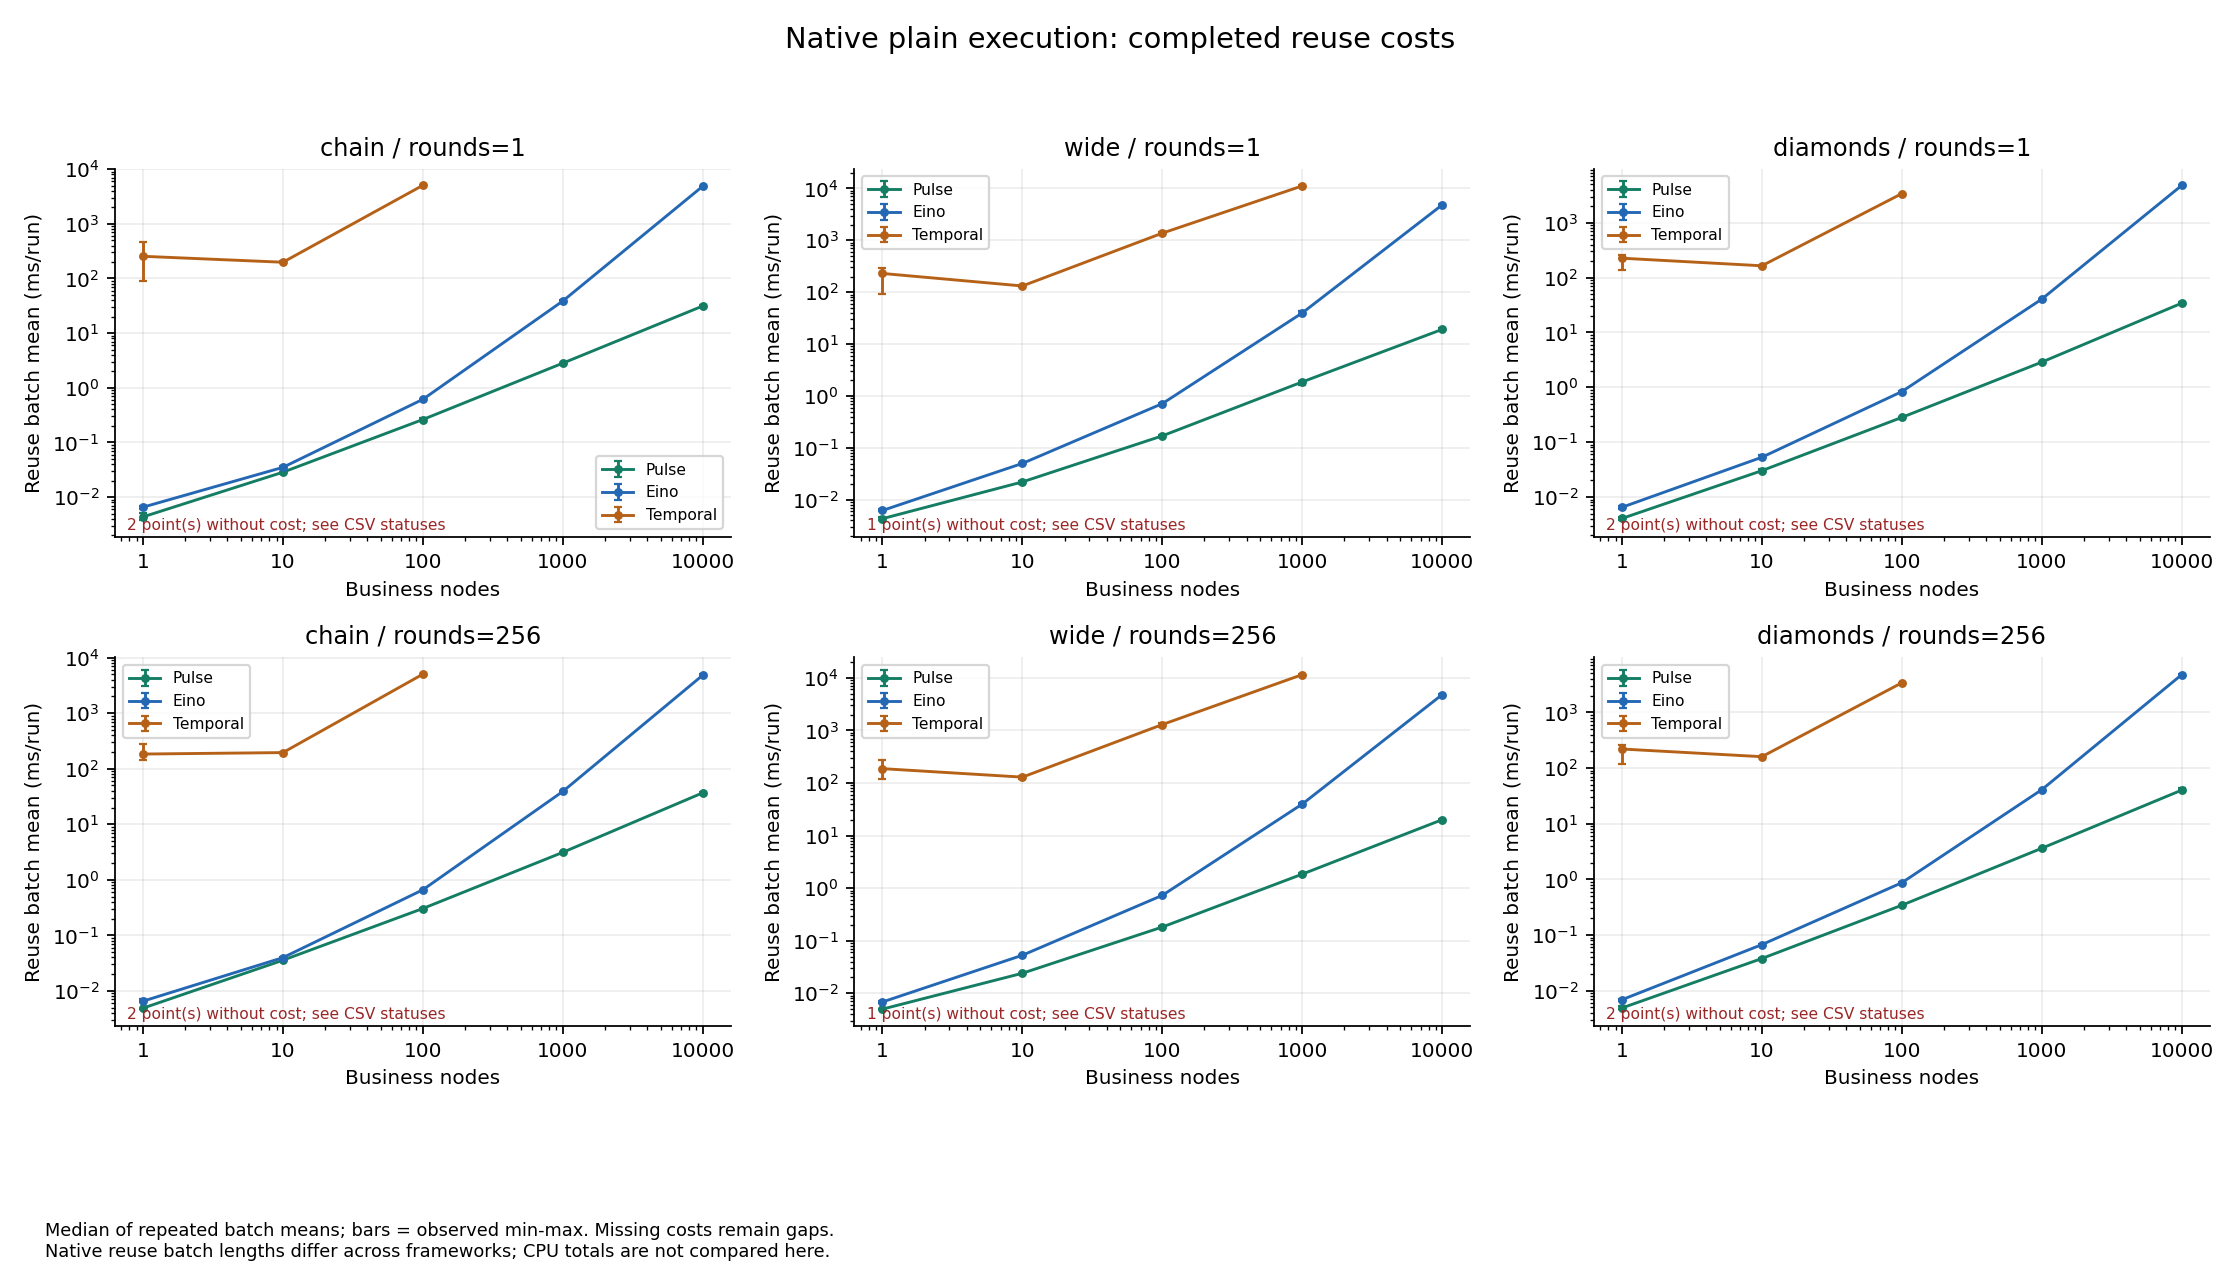
Temporal chain/diamonds N=1000 and every N=10000 configuration did not finish the whole case; no runtime is extrapolated and no wrong-result claim follows. Wide N=1000 completed. All Pulse/Eino native plain/observe plans completed. This tiny-task difference is not a proportional speedup for complete Agent applications. No profiles were collected this round, so curve changes are not attributed to proven internal hotspots.
| N=100 chain / stage | Pulse (ms) | Eino (ms) | Temporal (ms) |
|---|---|---|---|
| server_setup_ns | 0 | 0 | 364.083 |
| adapter_setup_ns | 0.0648 | 0.4919 | 66.1348 |
| first_ns | 0.4939 | 1.035 | 4186.82 |
| run_ns | 0.262107 | 0.613691 | 5049.45 |
Stage responsibilities differ: Pulse builds a graph and validates on first start; Eino assembles/compiles; Temporal adapter setup connects/registers/starts a worker, with Server preparation separate. First execution covers submission through correct-result confirmation; reuse is subsequent. Do not subtract stage medians for attribution. Temporal persistence is retained rather than presented as an equivalent in-memory guarantee.
Observation
| N=100 / shape | Pulse plain → observe (ms) | Eino plain → observe (ms) | Temporal plain → observe (ms) |
|---|---|---|---|
| chain | 0.262107 → 0.271002 | 0.613691 → 0.662909 | 5049.45 → 5052.55 |
| wide | 0.170895 → 0.173396 | 0.714113 → 0.741753 | 1374.74 → 1301.09 |
| diamonds | 0.282539 → 0.283872 | 0.834692 → 0.881922 | 3400.07 → 3398.72 |
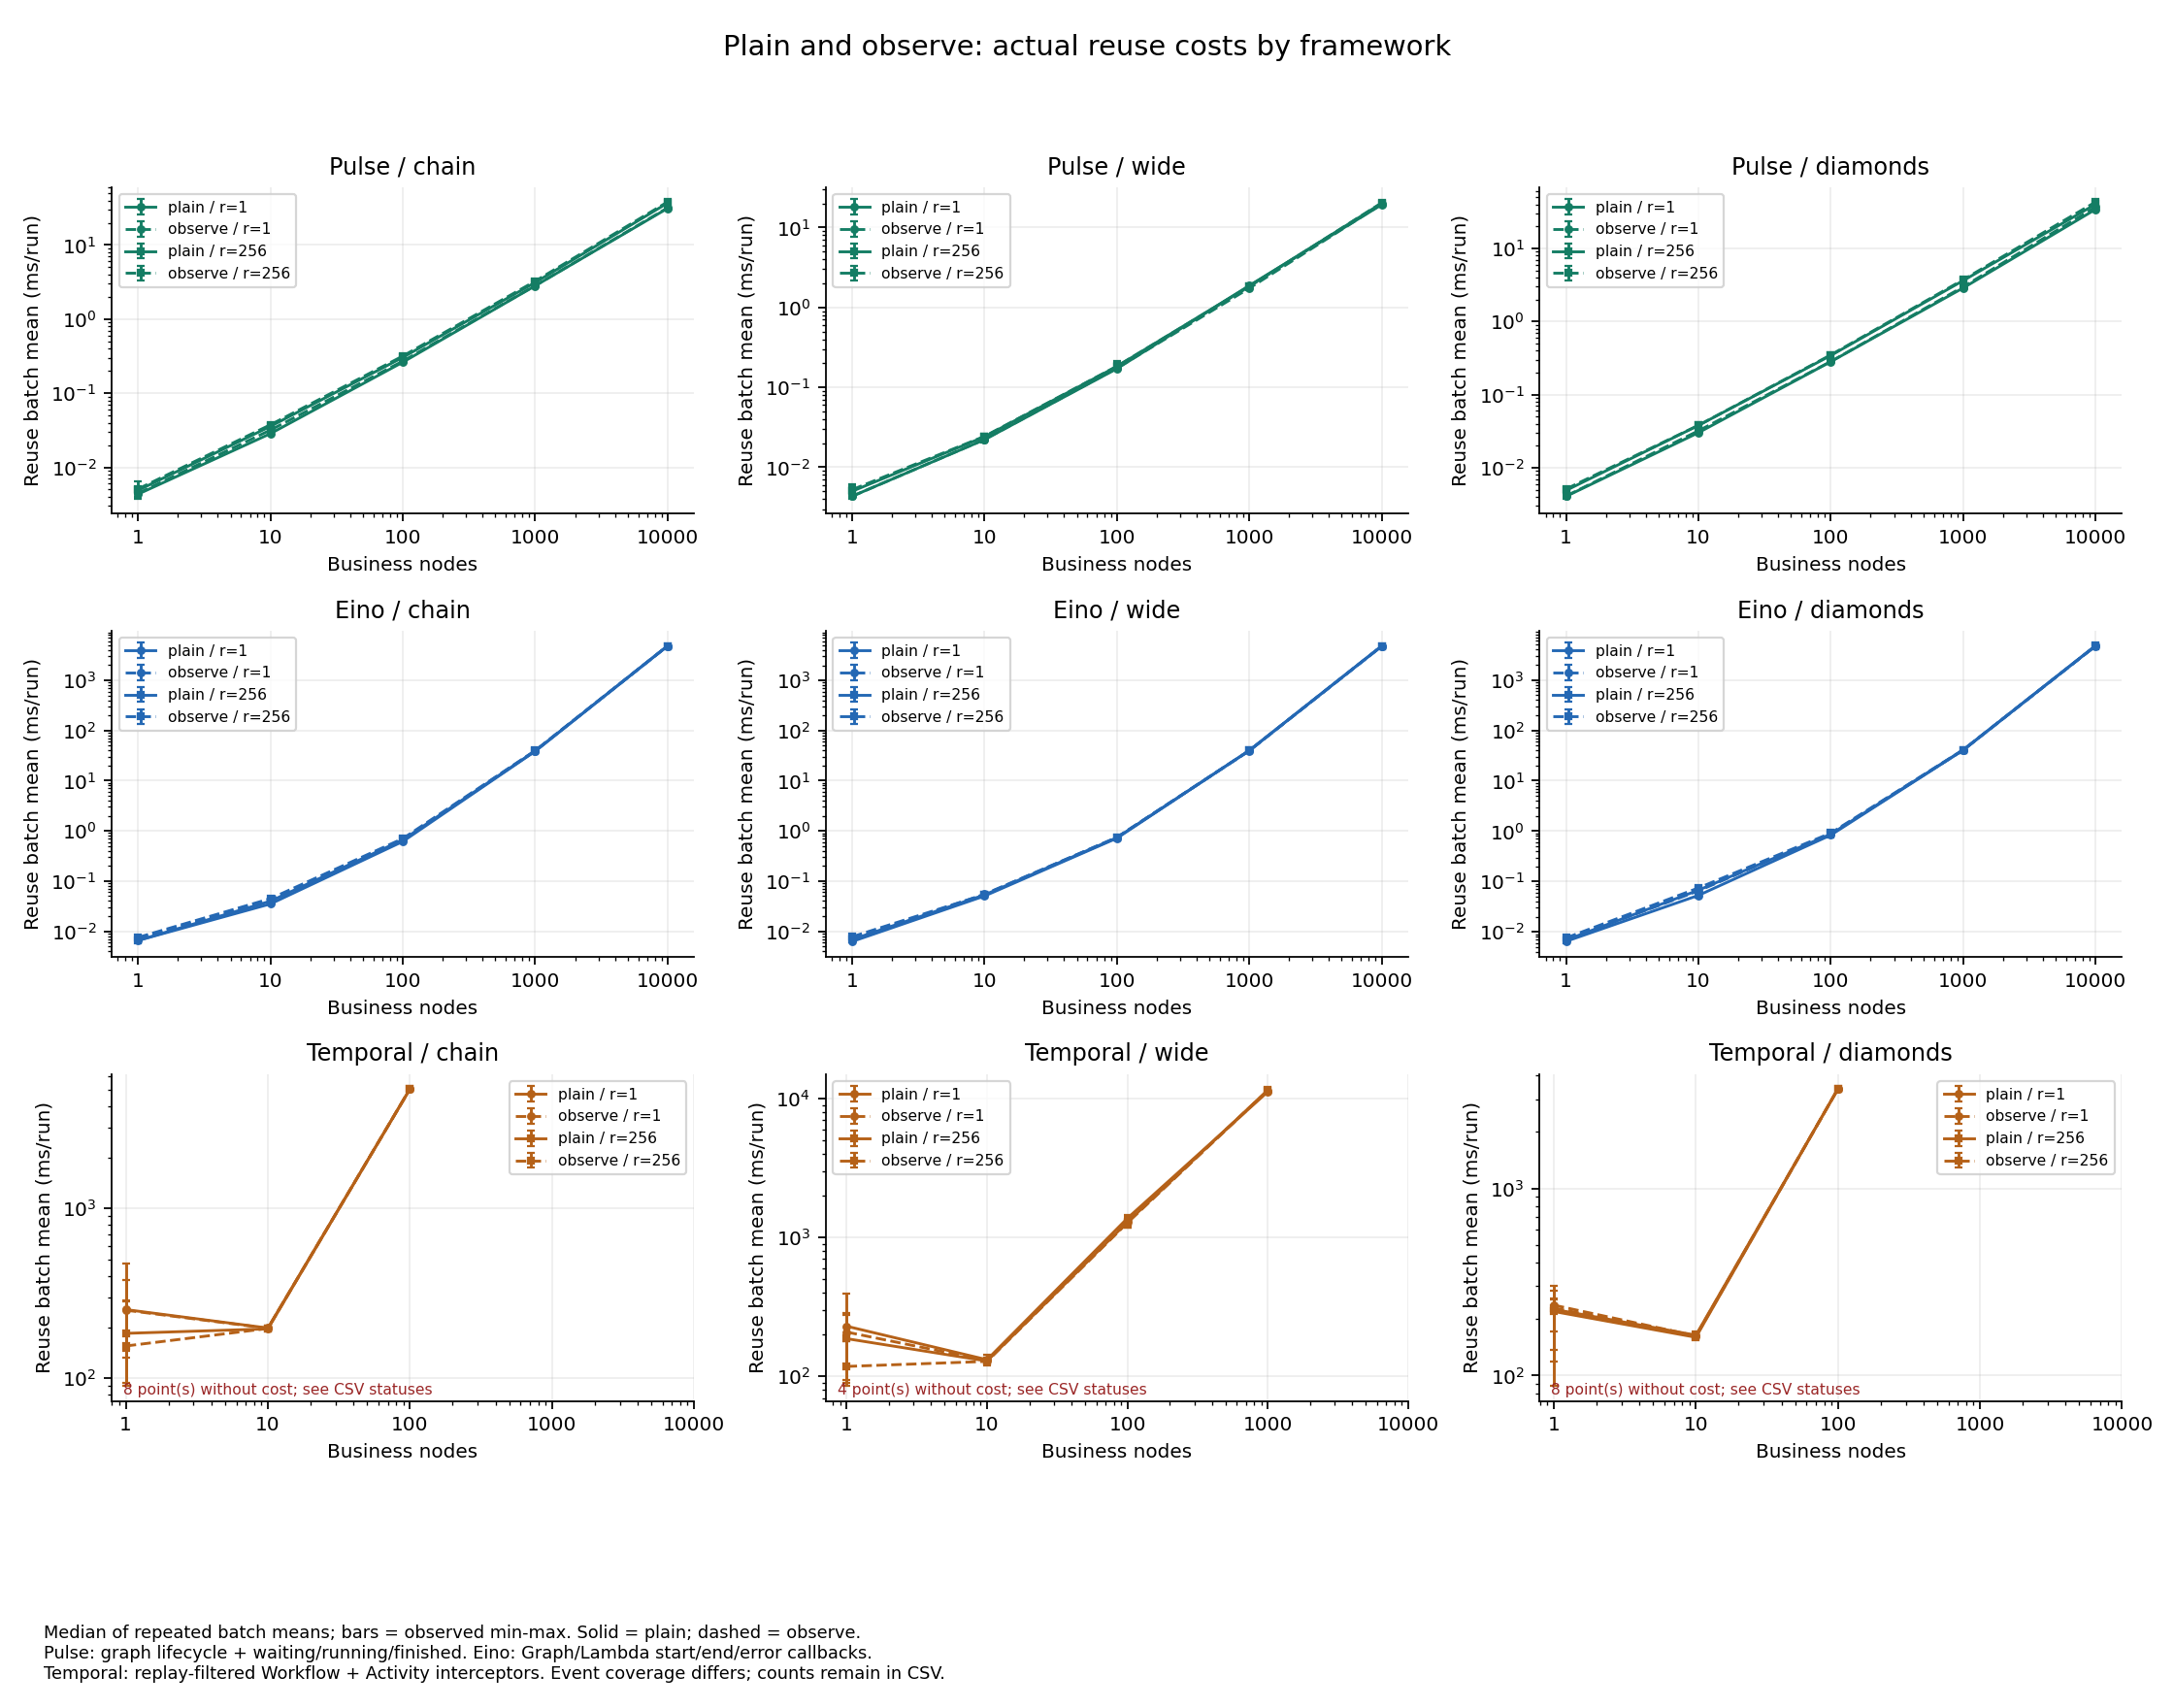
All use public extension hooks with atomic counters and no external logging. Coverage and event counts differ; differences are not prices for identical features. Some observe medians are lower: these are independently sampled variations, not evidence that observation accelerates execution. CSV retains event types/counts and ranges.
Equal-work CPU and memory
A separate resource experiment performs one first run plus one reuse for every framework, including process startup, preparation and GC. Temporal's independent Server belongs to the Windows Job. The table uses chain/rounds=1; CPU is seconds and RSS is MiB.
| chain / N | Pulse CPU s / RSS MiB | Eino CPU s / RSS MiB | Temporal CPU s / RSS MiB |
|---|---|---|---|
| 1 | 0.015625 / 18.3594 | 0.015625 / 17.793 | 0.609375 / 170.289 |
| 100 | 0.015625 / 18.3906 | 0.03125 / 17.7969 | 2.53125 / 213.496 |
| 1000 | 0.015625 / 18.4102 | 0.140625 / 26.9883 | — / — |
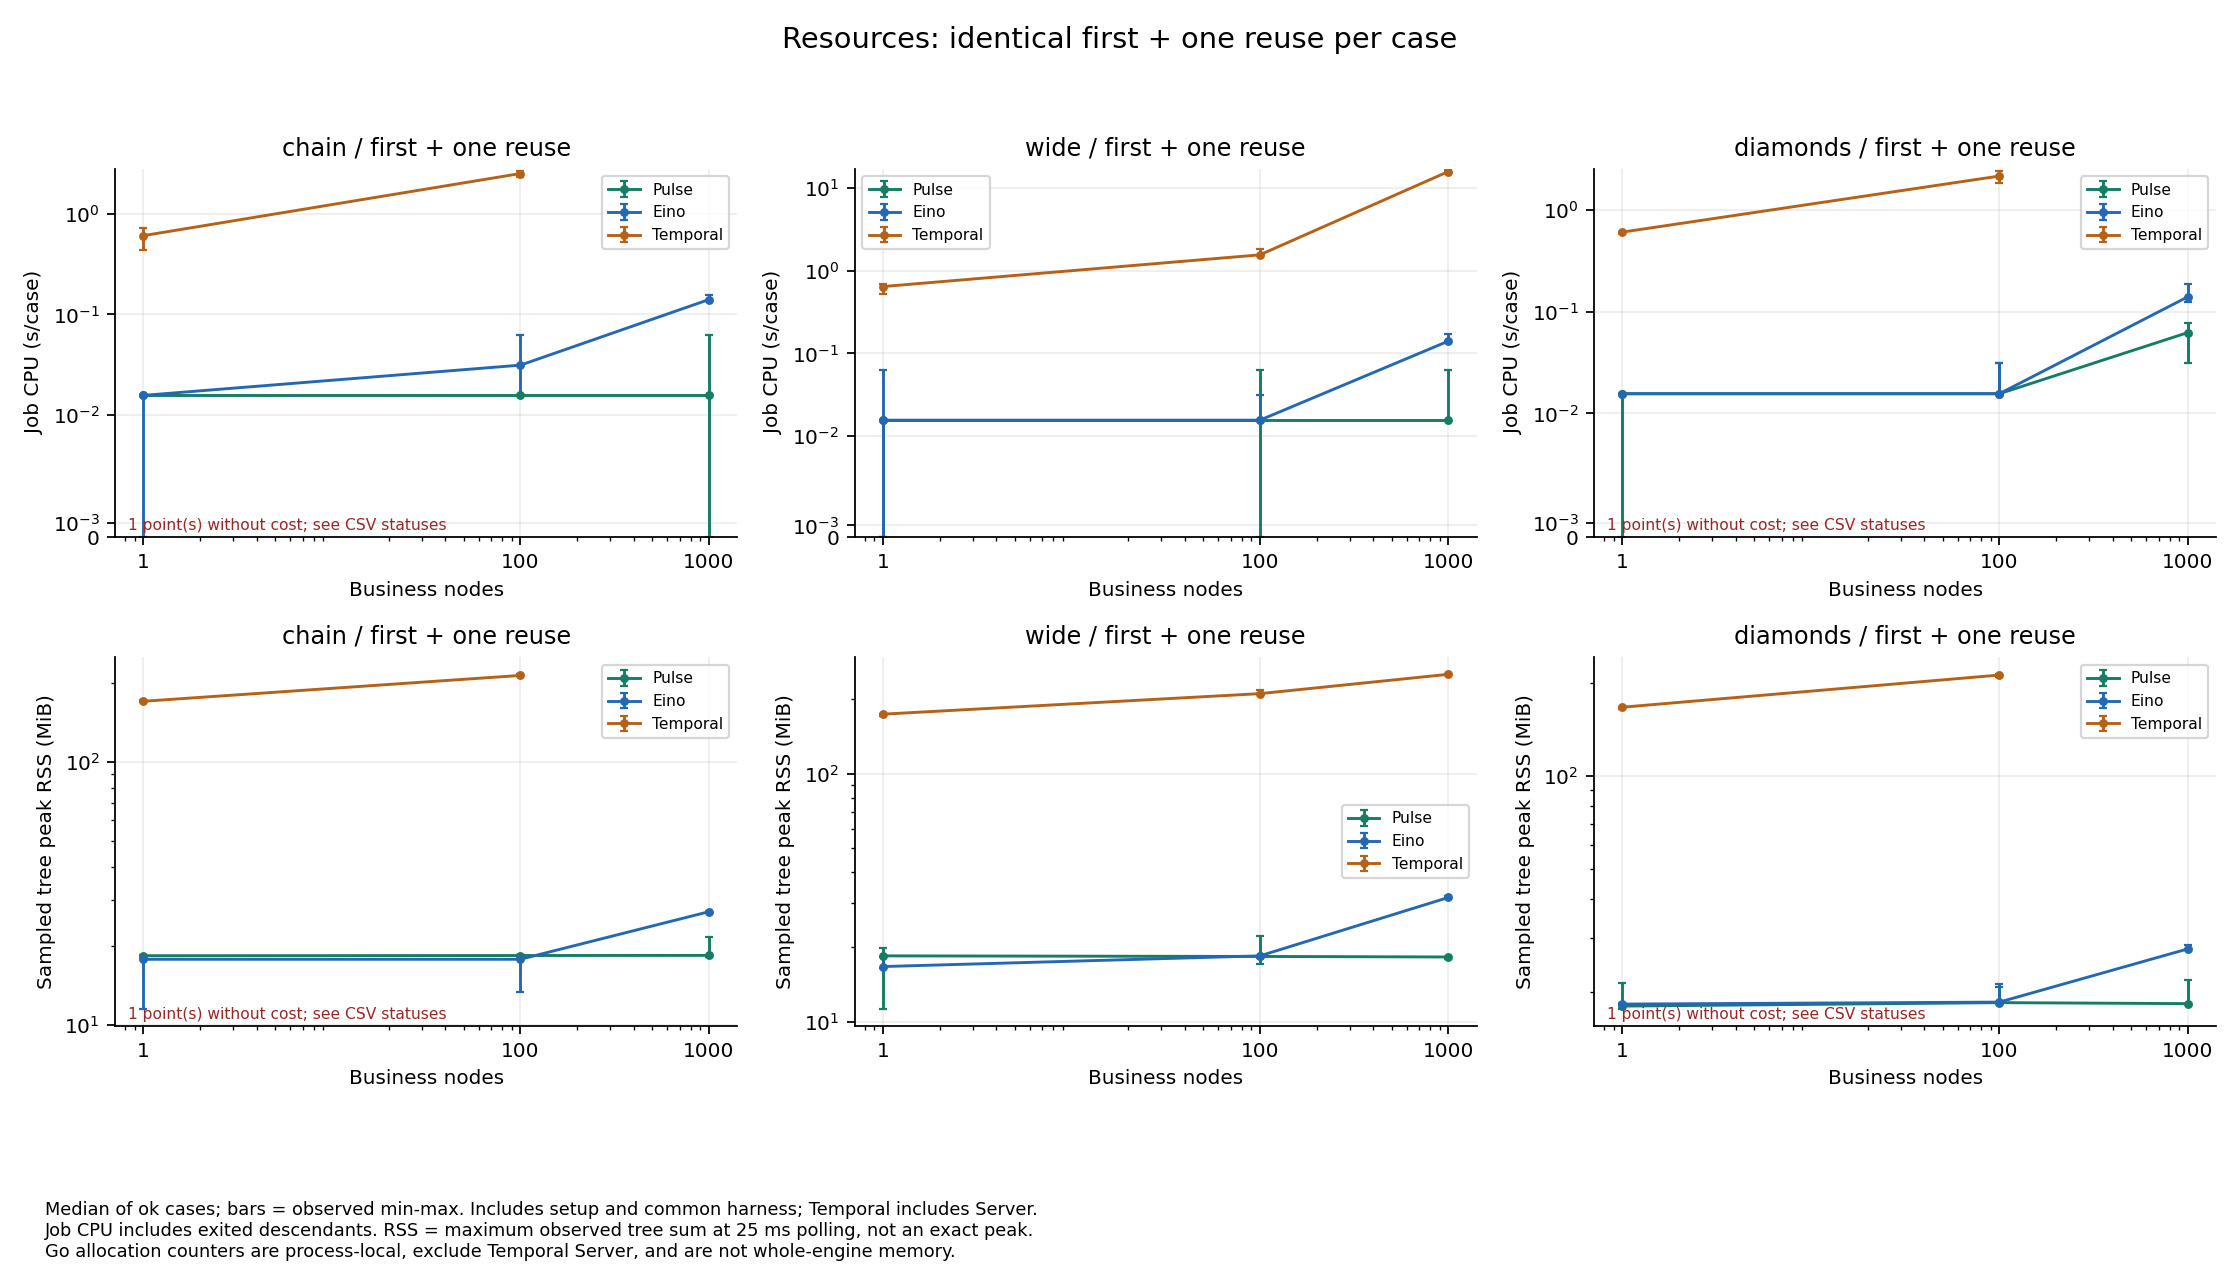
Job CPU includes exited descendants. Local process CPU accounting is quantized at roughly 15.625ms; equal small values do not prove identical CPU work. RSS is the largest simultaneous tree sum observed every 25ms and may miss a short peak. The common binary links all adapters: this includes a common harness baseline, not minimal standalone deployment footprints. Incomplete-case resources remain in raw data rather than completed-cost statistics.
CSV also retains cumulative process-local Go reuse allocations. Temporal Server is excluded from those counters, so they cannot rank whole-engine memory. Cumulative allocations, live heap and RSS differ. Native throughput batches and equal-work resource cases have different iteration counts; their total CPU is not mixed.
Reliable execution and storage growth
The formal SQLite rerun reports Pulse + Durable reliable confirmation below, in ms as first/reuse medians; n counts complete ok samples only. Eino ordinary success has no equivalent per-node checkpoint measurement here, while Temporal is shown as a native-persistence baseline rather than collapsed into one ranking.
| shape / N | Pulse + Durable first / reuse (ms) | status |
|---|---|---|
| chain / 1 | 10.364200 / 7.471000 | ok=3 |
| chain / 10 | 54.447100 / 53.536500 | ok=3 |
| chain / 100 | 600.267700 / 603.486300 | ok=3 |
| chain / 1000 | 12525.316300 / 14624.322000 | ok=3 |
| chain / 10000 | — / — | deadline=1, not_repeated=2 |
| diamonds / 1000 | 12985.821400 / 13829.337400 | ok=3 |
| wide / 1000 | 12879.575300 / 14727.901900 | ok=3 |
| wide / 10000 | — / — | deadline=1, not_repeated=2 |
Official sqlitestore v0.1.0 configures and reads back WAL/FULL; runtime Load/Save, CAS and local run ownership use that formal Store. Inspection connections, PRAGMA validation and setup costs are not engine graph construction. Process hard-kill is not power-loss testing; backup/restore, migration and distributed lease/fencing are not accepted here, and DB/WAL/SHM lengths are not cumulative physical writes.
Cross-process recovery
The formal recovery run uses chain/rounds=256, N=10/100/1000, confirmed prefixes 5/10/10, n=3 per configuration, with all 36 records completed. Pulse kills the host after confirmation and resumes in a new process; Eino saves a blob through active interrupt and resumes; Temporal separates runtime_kill from server_restart. These are confirmed boundaries without in-flight Activities/external effects and do not establish arbitrary exactly-once effects.
| Engine / scenario / N | n | wall s [min–max] | operation ms [min–max] |
|---|---|---|---|
| eino / active_interrupt / 10 | 3 | 0.049907 [0.046073–0.050180] | 24.372800 [21.061400–24.645800] |
| eino / active_interrupt / 100 | 3 | 0.046845 [0.044777–0.054857] | 21.419600 [21.387700–25.076200] |
| eino / active_interrupt / 1000 | 3 | 0.134673 [0.130496–0.136944] | 103.711600 [103.558600–108.297300] |
| pulse / runtime_kill / 10 | 3 | 0.072193 [0.065890–0.074435] | 19.992000 [19.426300–23.130100] |
| pulse / runtime_kill / 100 | 3 | 0.335978 [0.303561–0.389495] | 286.402000 [276.070700–328.842300] |
| pulse / runtime_kill / 1000 | 3 | 9.886758 [9.355772–10.618498] | 9804.680500 [9303.068600–10548.256300] |
| temporal / runtime_kill / 10 | 3 | 5.199157 [5.188746–5.213046] | 5134.301200 [5111.029900–5134.654700] |
| temporal / server_restart / 10 | 3 | 10.167985 [0.713383–10.179320] | 9884.872200 [441.128800–9916.820000] |
| temporal / runtime_kill / 100 | 3 | 8.647032 [8.632625–13.595738] | 8578.779300 [8567.382300–13526.297700] |
| temporal / server_restart / 100 | 3 | 4.080621 [4.029154–4.241825] | 3795.921100 [3757.966300–3846.748700] |
| temporal / runtime_kill / 1000 | 3 | 53.706356 [53.680285–53.717853] | 53615.510200 [53612.884800–53635.186500] |
| temporal / server_restart / 1000 | 3 | 49.185665 [49.084596–49.220536] | 48907.995200 [48819.051800–48933.869500] |
wall is controller recovery wall time; operation is the child-command scope, including Graph/Store or client reconstruction. Do not interchange them or rank wall time across semantics. Server-restart and worker-only recovery show counterintuitive ordering and broad ranges; without controlled diagnosis, no causal conclusion follows.
Data, reproduction and checks
The historical full-dimensional data remains in benchmarks/reports/2026-10-17-production/ with its compact CSV and identity. Current formal SQLite data is in sqlite-formal-20261023 summary.csv and identity.json. The external evidence root is go126-release-20261023/; raw records retain all failed and not-repeated states, while databases, logs and binaries stay outside the source repository.
The formal SQLite rerun independently reproduced checksums for 102 successful records and statistics for 57 groups; recovery completed 36/36. Its status is COMPLETED_WITH_ERRORS. It does not rewrite older Go 1.25 numbers as a Go 1.26 speedup or present this bounded collection as a full performance rerun.
Pinned sources: Eino v0.9.21, Temporal SDK v1.50.0, CLI v1.9.1.